Purpose
Now that you have set yourself up to get to work on DUNE/Q-Pix, it is time to start with a warm-up project to a) make sure everything is working the way it is supposed to be, and b) to familiarize yourself with how the software works.
Overview
This project is going to create and work with 2 samples: a 100 event sample of monoenergetic muons passing through LAr in a standard DUNE APA (detector unit), and a 100 event sample of simulated neutrino events in a standard DUNE APA. This project will involve the following steps:
Muon Sample
- Simulate 100 muon events in a standard DUNE APA using qpixg4
- Use the Geant4 data from qpixg4 and simulate detector response and pixel resets using qpixrtd
- Convert the .root file output from qpixar into a usable format (.txt) with qpixar
- Analyze the output with Jupyter notebooks
Neutrino Sample
- Simulate 100 neutrino events using GENIE
- Pass the neutrino event stable final state particles into the DUNE APA using qpixg4
- Use the Geant4 data from qpixg4 and simulate detector response and pixel resets using qpixrtd
- Convert the .root file output from qpixar into a usable format (.txt) with qpixar
- Analyze the output with Jupyter notebooks
The Project
Creating the muon sample:
1. qpixg4
qpixg4 is the Q-Pix software built to use Geant4 to simulate particles in a standard DUNE APA. DUNE Far Detector is a Liquid Argon Time Projection Chamber (LArTPC) detector made of 4 10kton fiducial mass modules. Because they are so large, each module is divided into smaller “units” by the frame cage and detector walls, otherwise it would be impossible to maintain conditions over such a large space. A standard DUNE APA is a single unit of detector and can be described as a volume with dimensions (x=2.3m, y=6m, z=3.6m) filled with liquid argon (LAr), with a detector wall on the x-y plane at z=0. In the first stage (the one that is approved, and being built), this detector wall uses multiple planes of wires as readout electronic technology. In the upgrade, these wires will be replaced by Q-Pix.
As the name suggests, Geant4 is an important part of qpixg4, and it is important to have an idea of how Geant4 works. If you don’t already have experience and are new to Geant4, documentation can be found here (will open a new window).
With all that out of the way, we can start by creating a mono-energetic sample of 100 muons passing through the DUNE APA. The macro to do this is found at /scratch/group/mitchcomp/DUNE/warmup/qpixg4_files/WarmUp_100Muon_10GeV.macro. Using the documentation from the wiki as a resource, create the Geant4 data as a .root file using the macro. Take time to read the macro, as there is commentary inserted to explain what each line in the macro does. It will create a file called “muon.root” in the same folder as the macro file. Since this is an example it will always create the file in the same place. If there is a muon.root already present in the directory, delete the file and create it again yourself. This is also a way to test that the software is working correctly.
$ cd /scratch/group/mitchcomp/DUNE/warmup/qpixg4_files/
$ rm muon.root (if applicable)

$ vim WarmUp_100Muon_10GeV.macro
Once you’ve looked over the macro file, you can run it to create a new muon.root file.
Remember, you have to setup the qpixg4 package before you use it to do anything. There is a setup script under /qpixg4/setup/setup_qpixg4.sh. You need to be in the setup directory in order for it to work (yes, it is poorly designed).
$ cd /scratch/group/mitchcomp/DUNE/software/qpixg4/setup/

$ source setup_qpixg4.sh
After running the previous commands, you should be in the qpixg4 directory. You can run the macro from the qpixg4 directory with the following command:
$ ./Build/app/G4_QPIX /scratch/group/mitchcomp/DUNE/warmup/qpixg4_files/WarmUp_100Muon_10GeV.macroOnce the macro is finished running, the qpixg4_files directory should contain both the macro and a new version of muon.root.
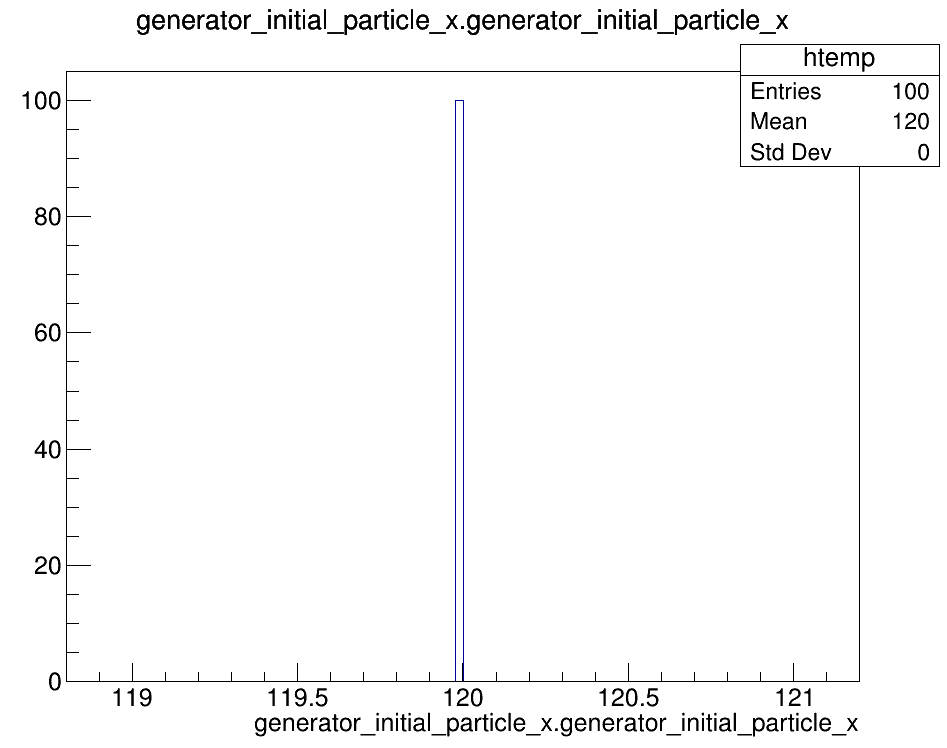
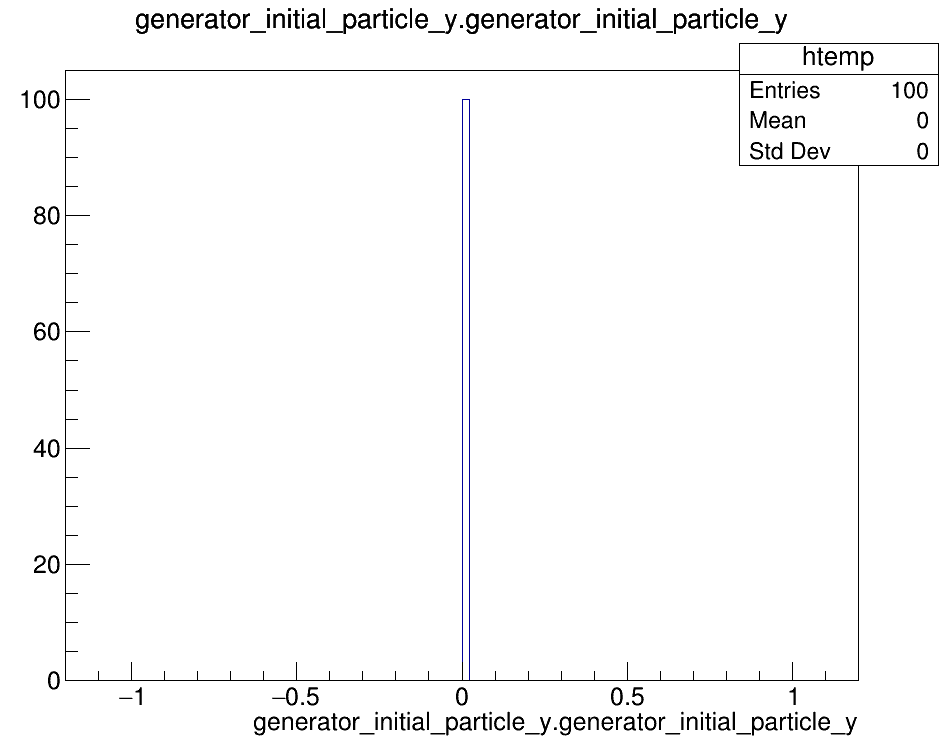
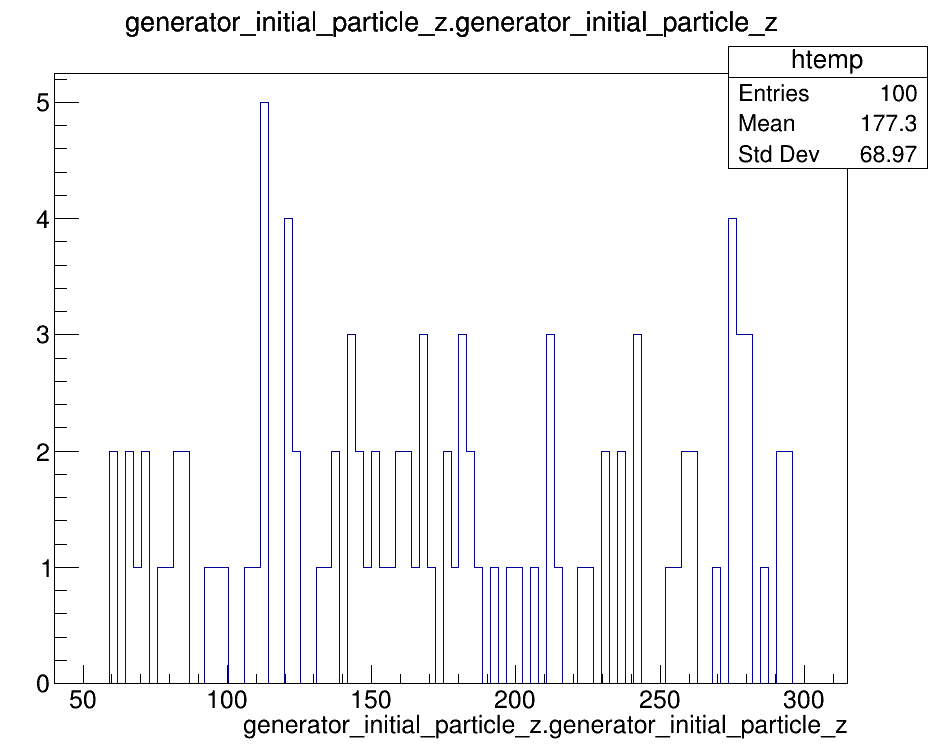
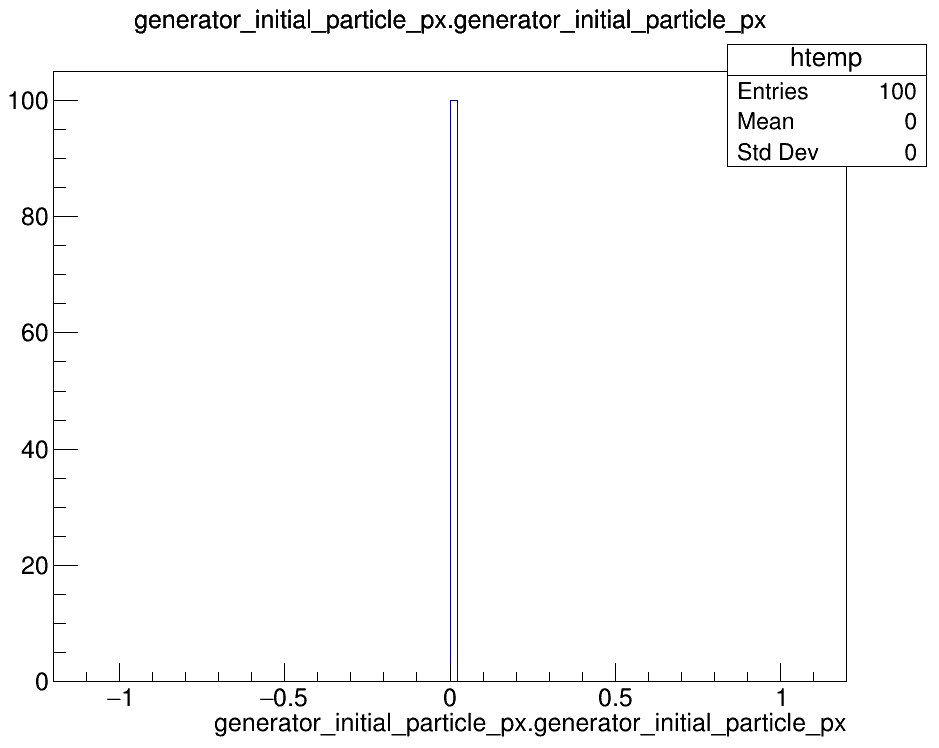
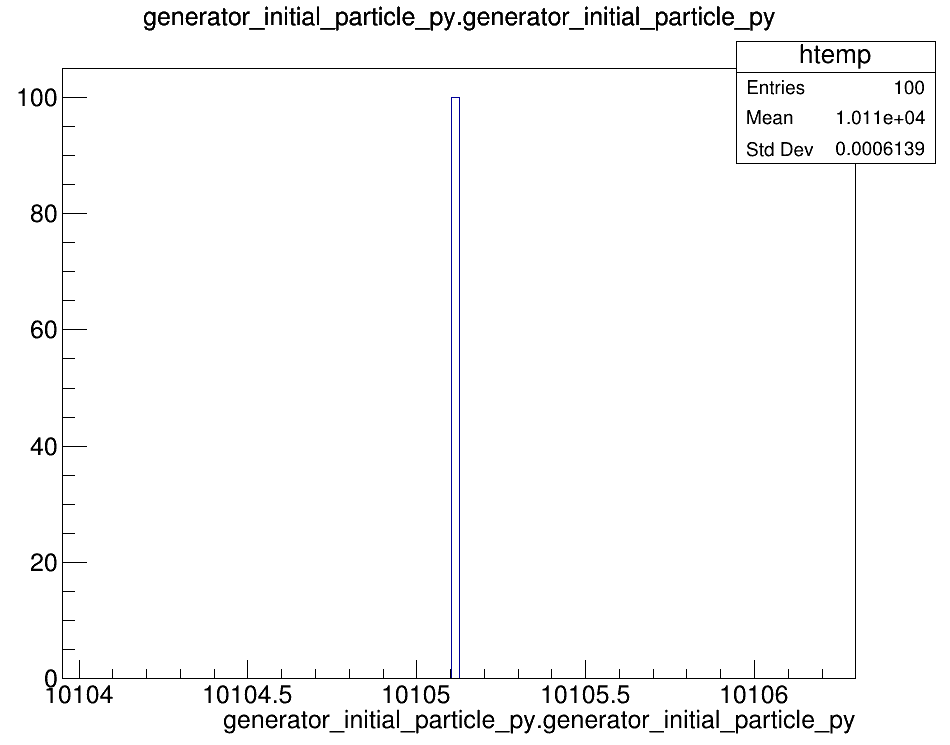
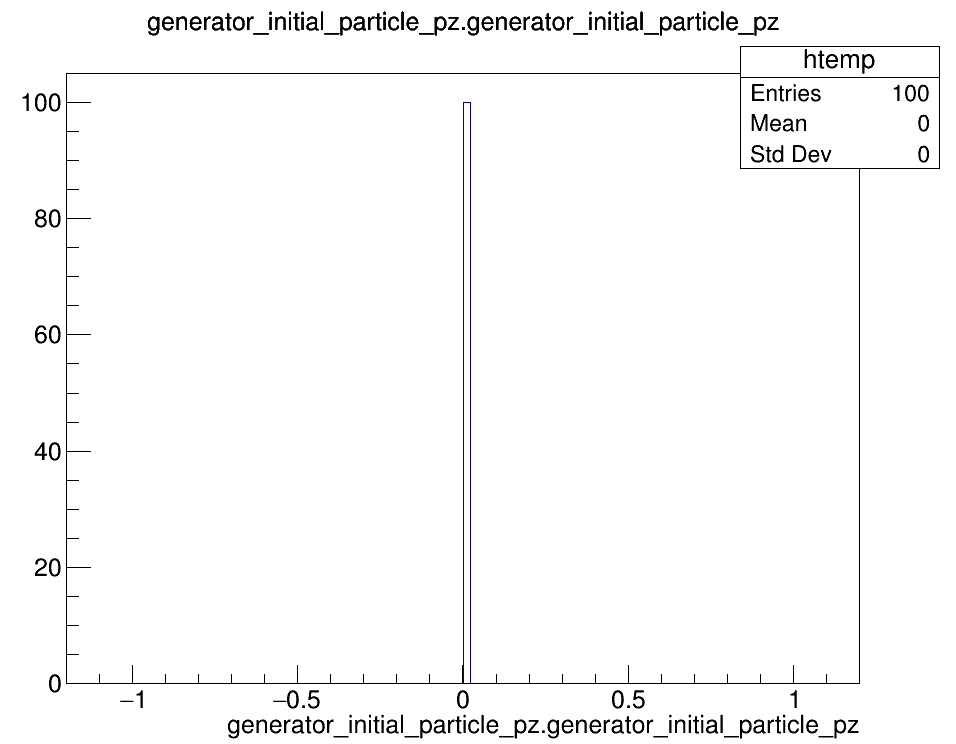
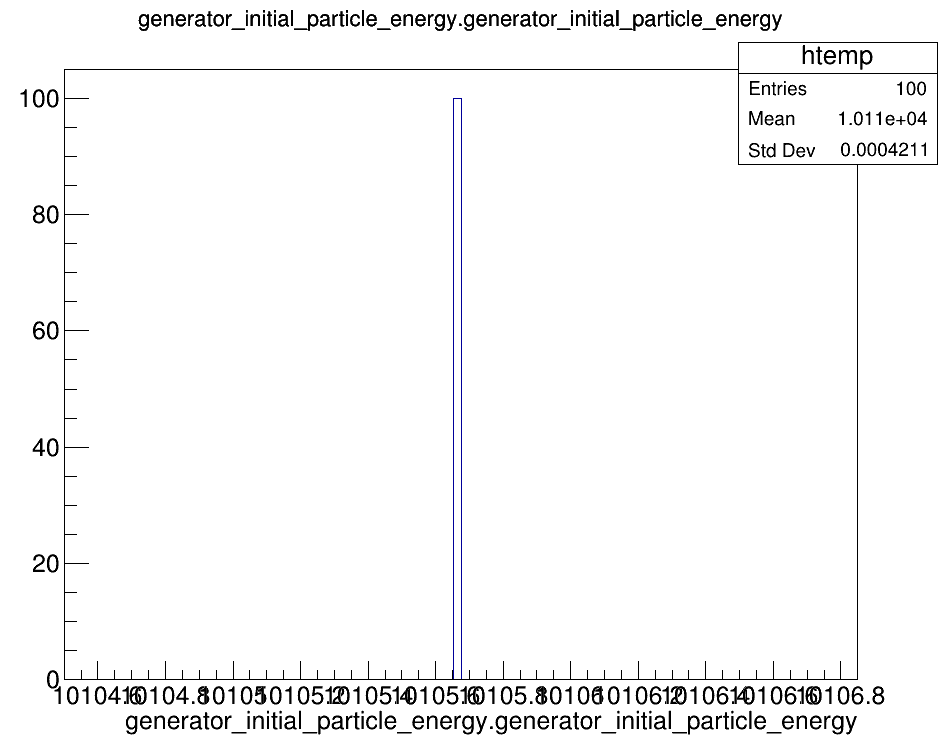
You are able to open muon.root to look at some of the plots. These plots show the distributions of each value in all the events. If the software worked correctly, there should be an exact match to the plots shown below. Access the plots by opening the file in root and opening a new TBrowser:
$ cd /scratch/group/mitchcomp/DUNE/warmup/qpixg4_files/

$ root muon.root

root [1] new TBrowser
The important thing to check is that you’ve made what you expected to make. The plots above show 100 generator particles (or events) as shown in the legend as Entries. All 100 events have an initial x-position of 120cm, y-position of 0cm, and a variable z-position. They also show only a positive constant y-momentum, which corresponds to the energy. If qpixg4 worked the way it should have, the only difference should be the z position, which should still look uniformly distributed, just not necessarily exactly the same. You can exit root by using CTRL +D or typing exit in the terminal.
NOTE: You can also do the job you just did above in batch mode using SLURM. Under the warmup/qpixg4_files/ directory, you will find a .slurm file that is complete with commentary to explain how it works. If you need more information, you can search for SLURM commands and examples online or view SLURM documentation for GRACE and TERRA.
Jobs in batch mode can be run in the background with a respective .slurm file, run with the command:
$ sbatch /path/to/slurm/file.slurm
Or specifically:
$ sbatch /scratch/group/mitchcomp/DUNE/warmup/qpixg4_files/qpixg4.slurm
2. qpixrtd
The next step in creating the muon sample is to convert the geant4 data from qpixg4 into a detector response. The way that DUNE works is inside the fiducial mass, there is a 500V/cm electric field pointing in the +z direction. This means any free positive charges are going to get pulled in the +z direction, and more importantly, all the negative charges are pulled in the -z direction. The data from qpixg4 includes the energy deposited by every particle involved in each event. For instance, a muon deposits ~2MeV/cm through ionization. As one of the properties of liquid argon, it produces ~42000 ionized electrons per MeV energy deposited. All of these electrons will be pulled in the -z direction, towards the detector wall (and therefore the charge pixels). These pixels turn the collected electrons into a series of resets, which in electrical terms are 1V pulses every time a reset threshold is reached. By passing the geant4 data into qpixrtd, we will get an output file of resets that are going to be like the data we expect to see coming out of DUNE.
You can use the RTD script that is found in the repository. You can find the code for the script under /qpixrtd/RTD/RTD.cpp. You will notice that there are 5 arguments/options that you can feed into the script.
- nonoise – toggles presence of noise in the data
- recombination – toggles whether or not free electrons are able to recombine with Ar atoms as they move toward the detector wall
- threshold – allows user to set the reset threshold (in units of electrons)
- input – the input file
- output – the output file
You can use qpixrtd to convert the qpixg4 data to a new .root file of resets with the following code
It’s recommended to create a /DUNE/warmup/ directories inside your scratch area to begin storing the output files in a convenient location for analysis.
You can create a directory by running the following:
$ cd /scratch/user/<username>

$ mkdir DUNE

$ cd DUNE

$ mkdir warmup
You can then use RTD code with the following sequence to convert the Geant4 data to the detector response:
$ cd /scratch/group/mitchcomp/DUNE/software/qpixrtd/

$ ./setup.sh

$ ./RTD/build/RTD -i /path/to/qpixg4/output/file.root -o /path/to/desired/output/file.root -t 6250 --nonoise
In our case, to access the muon.root file created from running qpixg4 and to store the new file in your warmup scratch directory, your last command should be:
$ ./RTD/build/RTD -i /scratch/group/mitchcomp/DUNE/warmup/qpixg4_files/muon.root -o /scratch/user/<username>/DUNE/warmup/<file_name>.root -t 6250 --nonoise It’s important to point out that a threshold of 6250 electrons corresponds to ~1fc charge. We are also starting with –nonoise activated to make it simpler. We are leaving recombination not activated for the same reason. Eventually, it will be important to include both of these, but for now we are taking baby steps.
At this point, you should have a new root file in your warmup directory that contains data of the detector response from the Geant4 simulation.
3. qpixar
At this point, there are many ways to proceed, but we are just going to use the archaic method setup already, while noting better methods could definitely be developed. To use qpixar, you need to have to have uproot and python. Uproot is a cool python-compatible way to read root files. We are going to be using the root_to_csv.py file, then the recombine_sample.py file. These files will first open the .root file made by qpixrtd, then convert all the data to pandas dataframes and save the final data as .txt files.
You can review the code for both the root_to_csv.py and recombine_sample.py programs by changing to the root_to_csv directory:
$ cd /scratch/group/mitchcomp/DUNE/software/qpixar/root_to_csv/
It’s important to note that HPRC limits programs runtime in interactive mode to 1 hour. The runtime for root_to_csv.py is longer than one hour, so you must use a slurm file instead. There is one available to you in the qpixar_files. You should make a copy, move it to your scratch directory, and then edit it there. This can be done by running:
$ cd /scratch/group/mitchcomp/DUNE/warmup/qpixar_files/

$ cp RootToCSV.slurm /scratch/user/<username>/DUNE/warmup/<your_slurm_file_name>.slurm

$ cd /scratch/user/<username>/DUNE/warmup/

$ vim <your_slurm_file_name>.slurm
You should now edit your slurm file to work with the files you’ve created. Make sure you change the following in your new slurm file:
Change 1 – Account Number:
Change ‘123456’ to your account number (can by found by submitting ‘myproject’ in the command line)
Change 2 – RTD File Path:
Change ‘/scratch/group/mitchcomp/DUNE/warmup/qpixrtd_files/muon_rtd.root’ to /scratch/user/<username>/DUNE/warmup/your_rtd_file_name.root
Change 3 – Email:
Change ‘EMAIL’ to your email address
You can also change –job-name and –output to different names for your records.
After making the necessary edits, save and close your .slurm file.
You can submit the job in batch mode by running:
$ sbatch /path/to/slurm/file.slurm
Or Specifically:
$ sbatch /scratch/user/<username>/DUNE/warmup/<slurm_file_name>.slurm
When the slurm file is done, there will be a new directory in your warmup with the name:
<your_rtd_file_name>_yyyy_mm_dd_hhmmss
Where yyyy_mm_dd_hhmmss is the date and time for when you submitted your batch job.
Take a look into your new directory to see all the .txt files from each event. The next step is to the use the recombine_sample.py script to combine all the separate .txt files into a single .txt file to use for analysis.
To combine all the .txt files, you can run the following commands:
$ cd /scratch/group/mitchcomp/DUNE/software/qpixar/root_to_csv/
$ python recombine_sample.py /scratch/user/<username>/DUNE/warmup/<directory_containing_txt_files>
You can verify the program ran correctly by moving back to the directory containing the .txt files and verifying that both g4_output.txt and resets_output.txt exist.
An easy way to check this is by listing every filename that ends with ‘_output.txt’:
$ cd /scratch/user/<username>/DUNE/warmup/<directory_containing_txt_files>
$ ls *_output.txt
4. Analysis with Jupyter Notebooks
You can now jump to using pure python for your analysis. You can either continue to work in bash, or HPRC has a very handy OnDemand portal, which allows you to pull up Jupyter notebooks in your web browser. This is not only what I think to be the best way to do it, but also the only way I had time to work with, so I recommend it to you as well. Once you are on the VPN, you can access the Grace OnDemand portal by following this link to Grace OnDemand Portal (opens in new window). See the DUNE Onboarding page for more information on launching an interactive session.
To complete this first part of the warmup project, you will need to write python code that will read in the reset and g4 data and be able to plot events in a few different ways.
Plot Set 1:
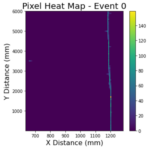
Create a 2D heatmap histogram where the 2D histogram bins are individual pixels and the bin fill is the number of resets on that individual pixel. This is done for each individual event.
|
Outline:
Note: We want to plot these resets as distances instead of pixel numbers – multiplying these pixels’ numbers by their size (4mm x 4mm) will provide the pixels distance. |
Example Plot Set 1:
Plot Set 2:
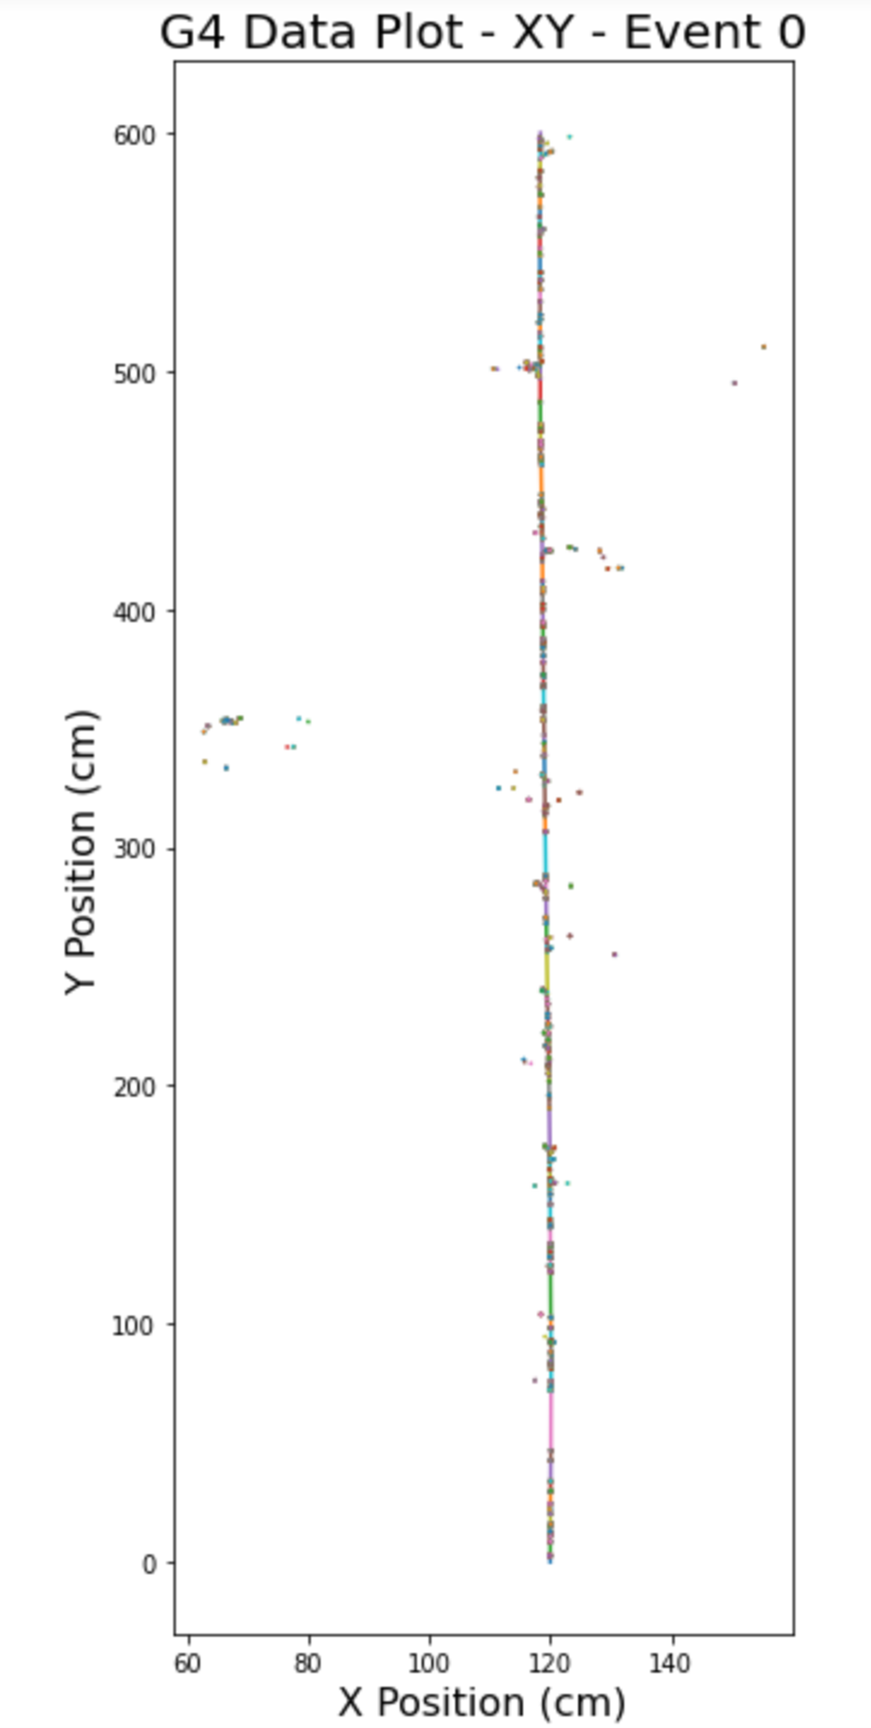
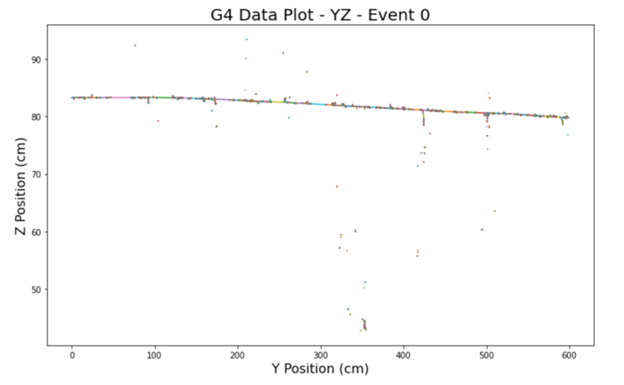
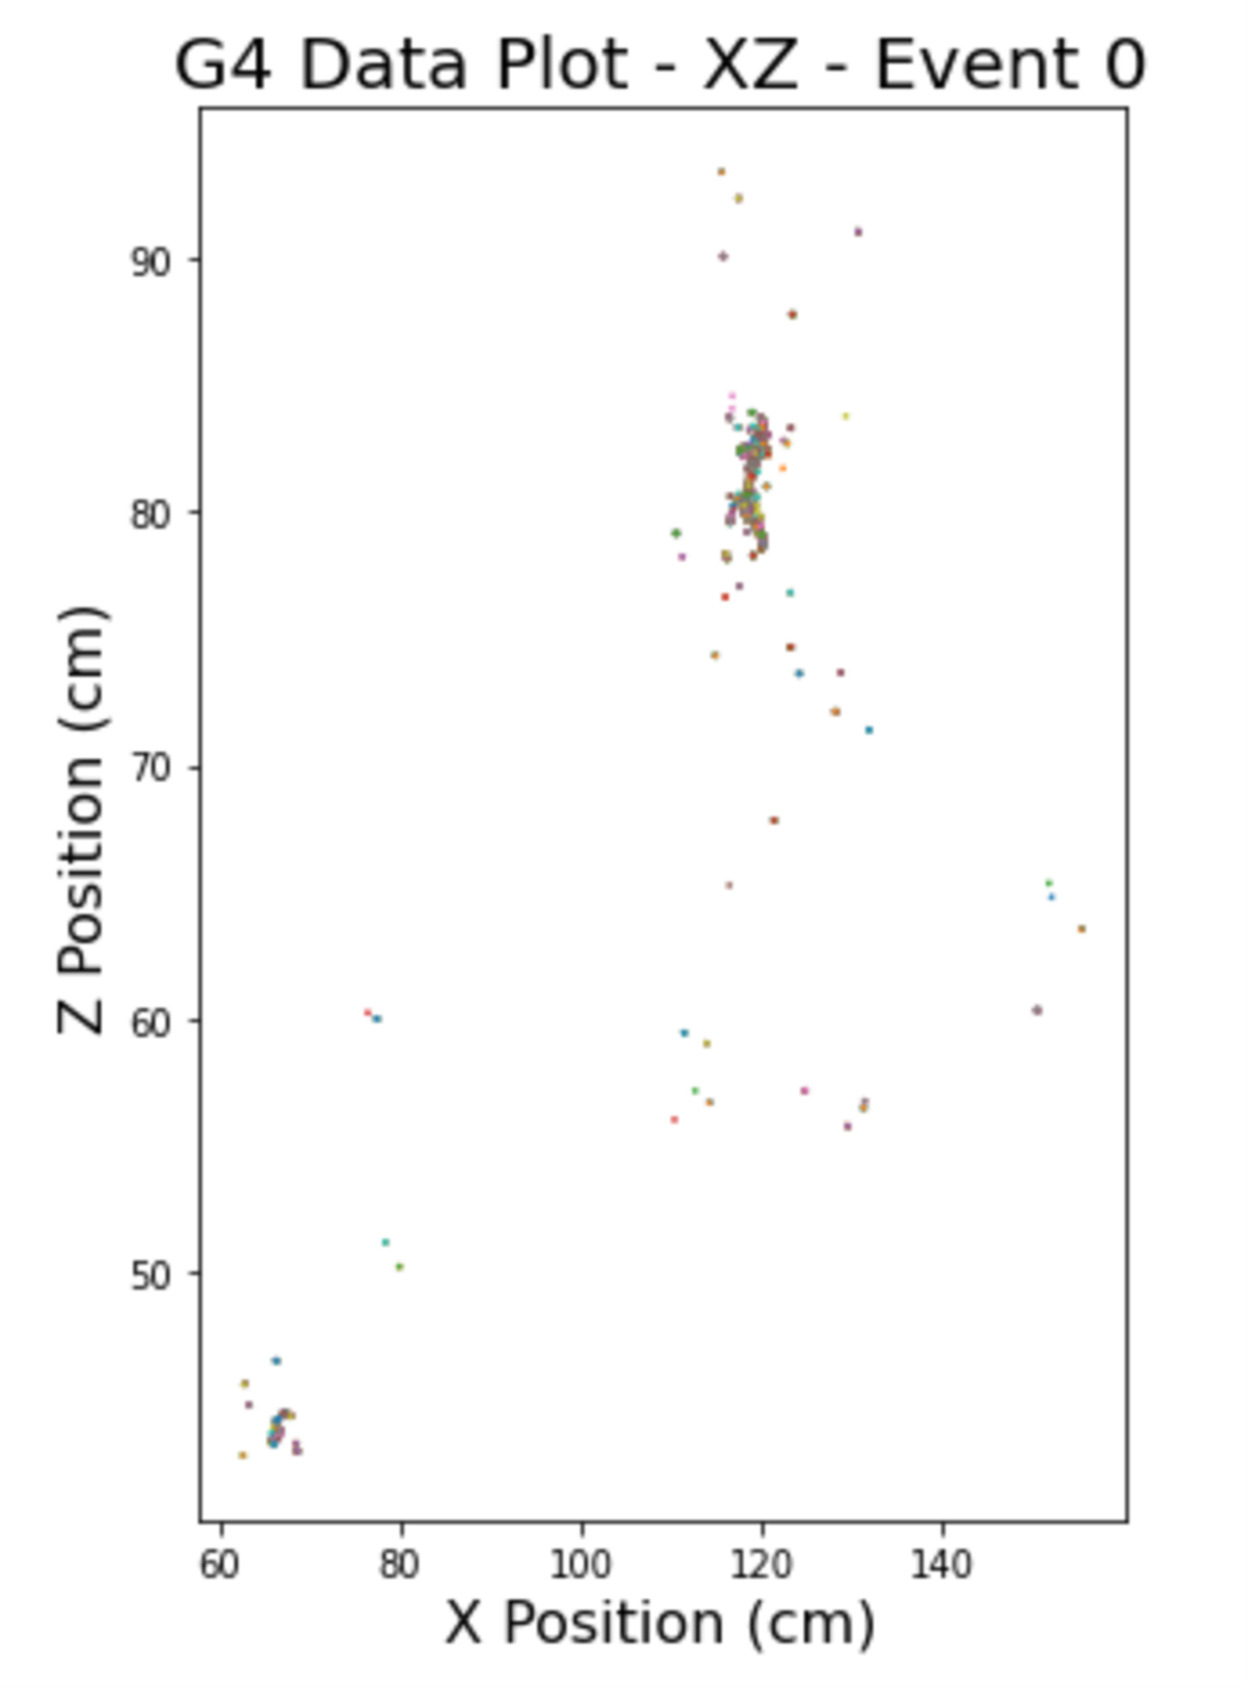
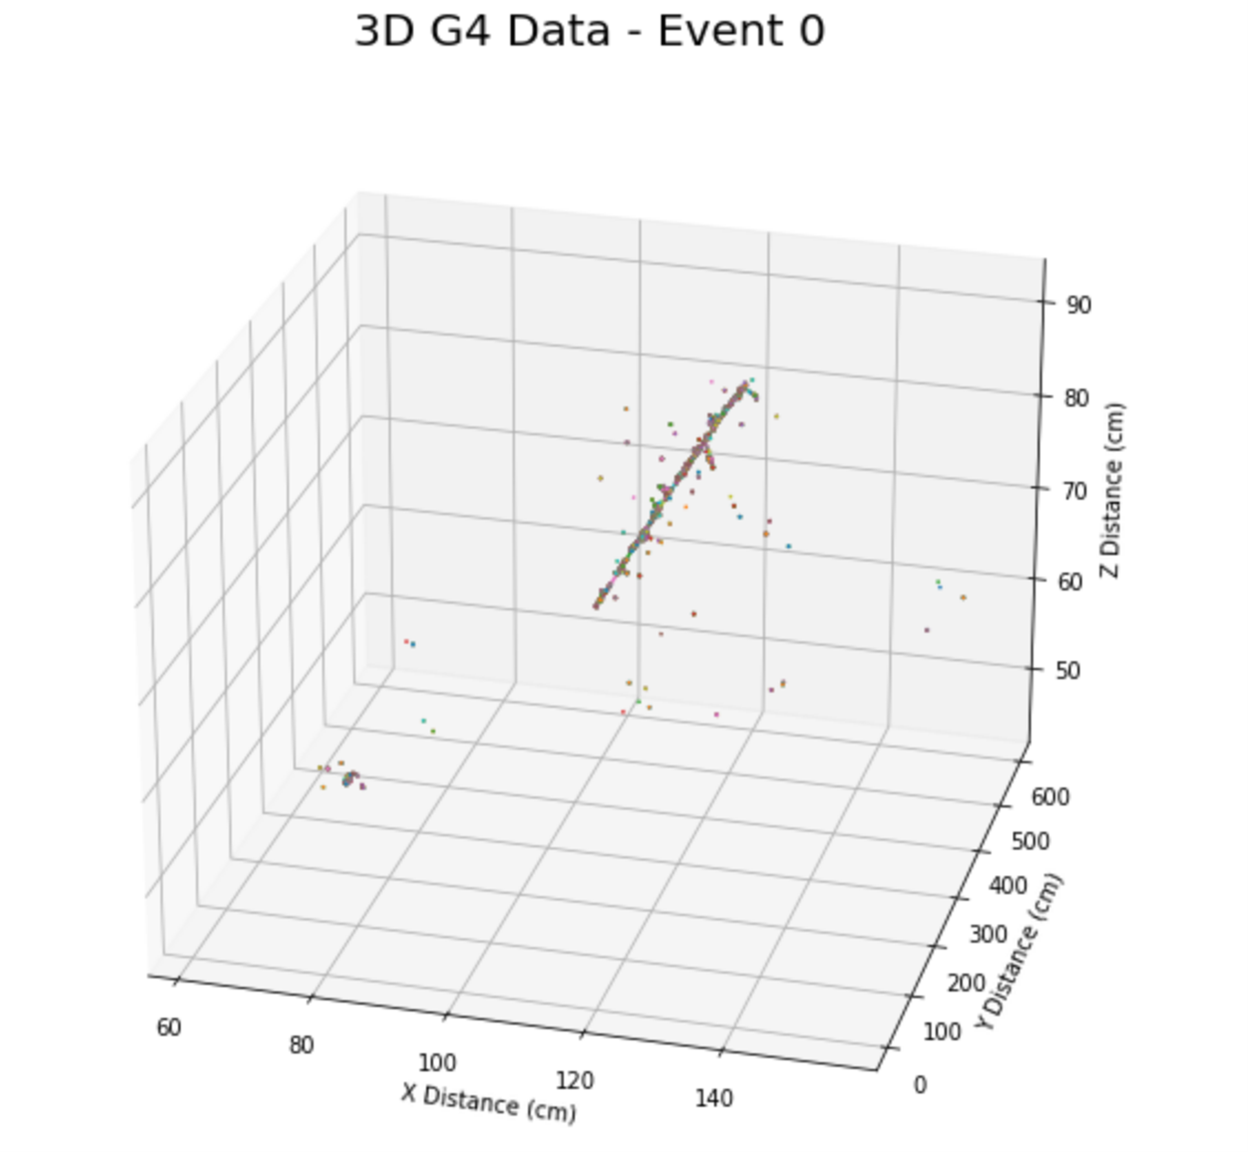
Create 4 separate plots (for each event) showing the Geant4 data. You will create a X-Y, Y-Z, X-Z, and a 3D plot of the muon passing through the detector. The Geant4 data has an initial x,y,z,t as well as a final x,y,z,t. Instead of plotting the individual points, you should plot the lines from the initial position to the final position.
Note: The dimensions of the DUNE APA are 2.3m x 6m x 3.6m, so you may want to adjust the dimensions of your plots to make the picture easier to understand
X-Y Plot Outline:
1. Read in the g4_output.txt file to your notebook
2. Record the initial and final x and y positions in respective arrays (recording the x’s and y’s corresponding to the event number of interest)
3. Plot the lines from (x_i, y_i) to (x_f, y_f)
Y-Z Plot Outline:
1. Read in the g4_output.txt file to your notebook
2. Record the initial and final y and z positions in respective arrays (recording the y’s and z’s corresponding to the event number of interest)
3. Plot the lines from (y_i, z_i) to (y_f, z_f)
X-Z Plot Outline:
1. Read in the g4_output.txt file to your notebook
2. Record the initial and final x and z positions in respective arrays (recording the x’s and z’s corresponding to the event number of interest)
3. Plot the lines from (x_i, z_i) to (x_f, z_f)
3D Plot Outline:
- Read in the g4_output.txt file to your notebook
- Record the initial and final x, y, and z positions in respective arrays (recording the positions corresponding to the event number of interest)
- Plot the lines from (x_i, y_i, z_i) to (x_f, y_f, z_f)
Example Plot Set 2:
Plot Set 3:
Show each event’s individual pixels’ average reset_time vs. RMS. You will filter the pixels by only considering the pixels that had 3 or more resets. This lets us see RMS spikes at specific ToAs correlating to different interactions.
|
Outline:
|
Example Plot Set 3:
